How maintenance request digitisation cuts downtime
Most downtime starts before anyone picks up a spanner. Here’s how digital requests speed up reactive maintenance management, from report to fix.

Most downtime starts before anyone picks up a spanner. Here’s how digital requests speed up reactive maintenance management, from report to fix.
It's time to break the reactive loop. Becoming a Strategic Facilities Manager shows you how.
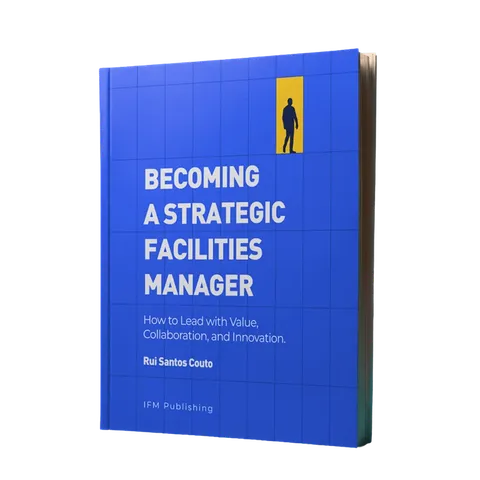 Learn more
It’s 7:40 on a Monday. A guest tells reception the lift in the east wing is making “a weird noise”. Reception tells the duty manager. The duty manager posts it in the maintenance WhatsApp group, right under Friday’s memes, where it gets two thumbs up and no replies. At 11:00 the lift stops between the third and fourth floors. The first thing your technician asks is “Why did nobody tell me?”
Somebody did. Three people, in fact. The problem just never turned into a work order.
A lot of downtime hides in the gap between someone spotting a problem and your team knowing about it. It rarely shows up in your reports. Most guides to reactive maintenance management skip it too, because repair times are much easier to measure than a message lost in a group chat.
So let's take a breakdown stage by stage, find where the time goes and win it back with digital requests.
Breakdown maintenance will always be part of FM. Assets fail, people notice and someone has to fix it. What you can control is how much time you lose between those steps.
Every reactive job goes through five stages:
Spotted — someone notices the problem.
Reported — the problem reaches the maintenance team.
Understood — the team knows what’s broken, where it is and how urgent it is.
Assigned — the right technician is on it, with what they need.
Fixed and closed — the asset works again, the job is logged and the person who reported it knows.
Here’s the uncomfortable part. In many teams, the MTTR clock starts at stage four, when someone creates the work order. Stages one to three happen off the record, in phone calls, corridor chats and emails titled “URGENT!!!”. Your dashboard says the lift was down for 90 minutes. The guests who’ve been taking the stairs since 11:00 would disagree.
Those delays add up. 48% of delays in work order execution stem from miscommunication, and 44% of FMs find work order tracking time-consuming.
Stage | With calls, paper and chat | With digital requests |
|---|---|---|
Spotted | Whoever notices has to know who to tell. Most don’t, so they tell the nearest person. | A QR code or NFC tag on the asset shows them where to report it. |
Reported | The request passes through two or three people before it reaches maintenance, and details drop off at every hop. | The request goes straight into your system as a work order, in seconds. |
Understood | Your team calls back to ask which floor, which unit and whether it’s “broken broken” or just noisy. | The tag supplies the location and asset. A photo and a problem type cover the rest. |
Assigned | Someone reads the request, works out who’s free and chases them. | Rules send each request type to the right team, with the right SLA attached. |
Fixed and closed | The technician fixes it, the paperwork waits until Friday and the person who reported it never hears back. | The technician closes the work order on their phone, and the asset’s history updates as they go. |
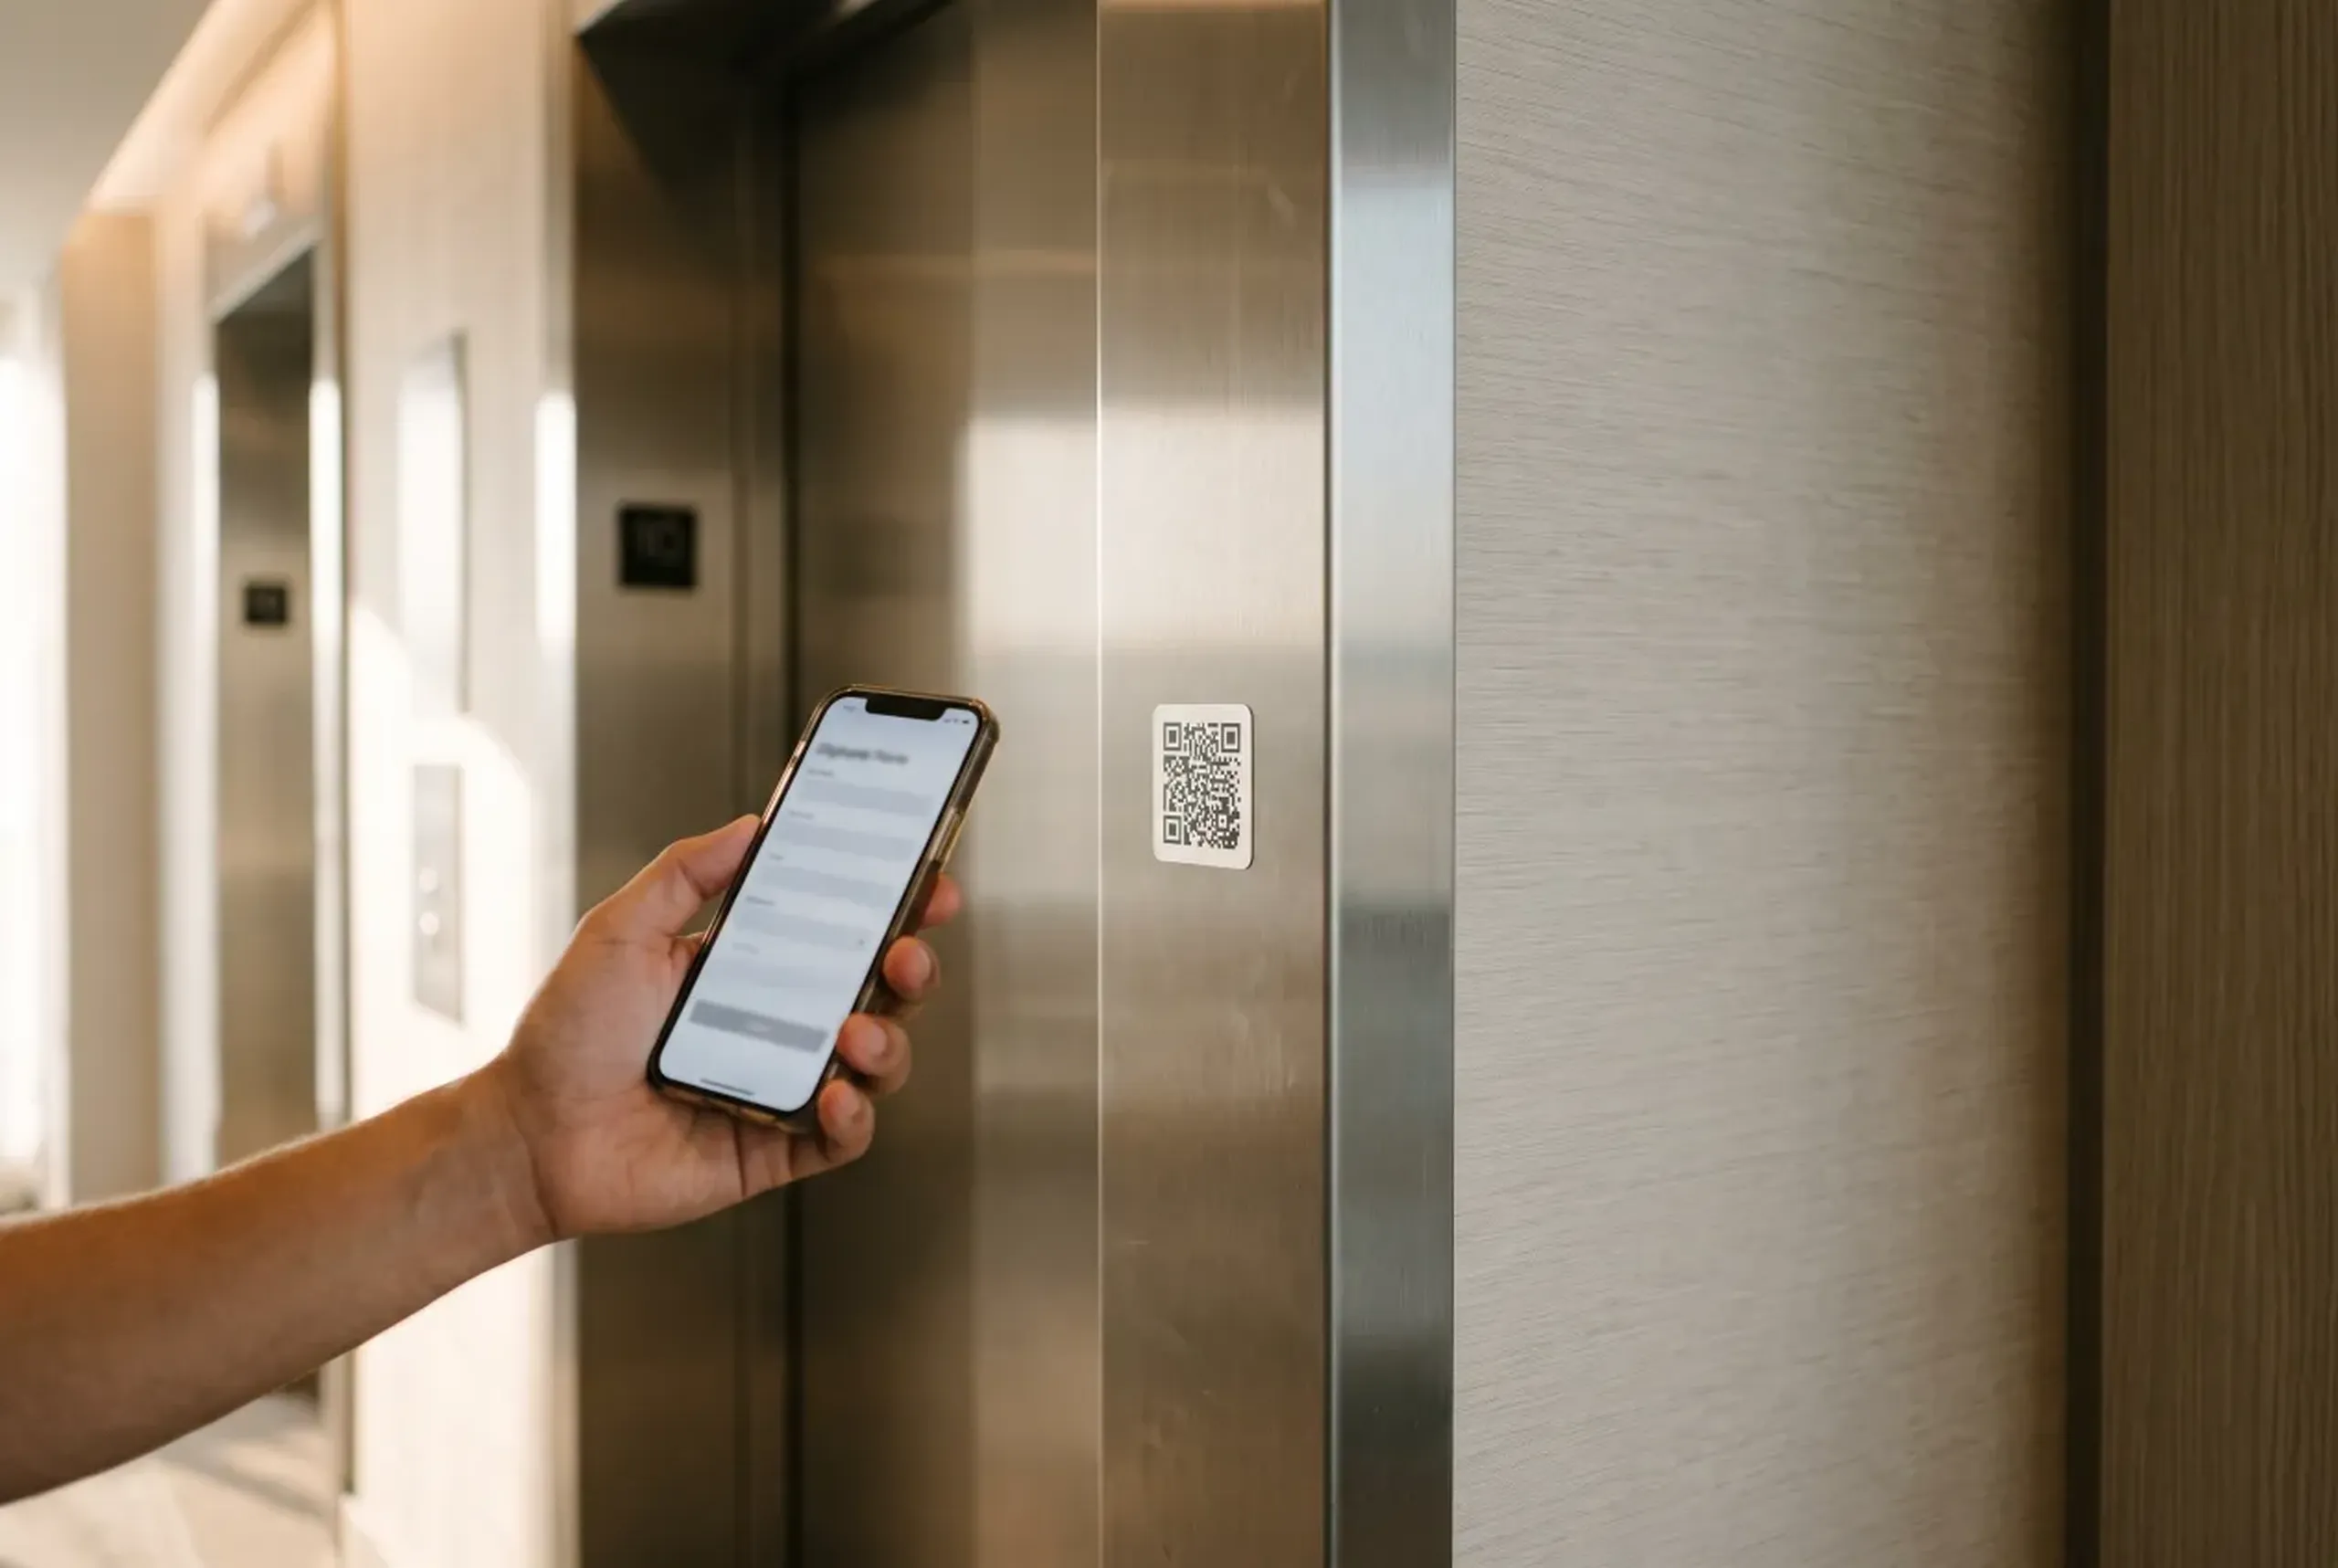
The fastest request is one that needs no instructions. Put QR codes or NFC tags on your assets and locations. Start with the ones that break most and annoy people most, like lifts, toilets and the coffee machine on the fourth floor.
With the Infraspeak Direct Page, anyone can scan a QR code with their phone camera and report a problem. They pick the area and problem type, add a description or photo if they like, and submit. They don’t need a login, an app or the helpdesk number off a laminated sign. The work order is created and appears in Infraspeak straight away.
New to tagging? Our guide to asset tagging covers where to start.
A vague request costs you a second trip. Each tag belongs to a specific asset or location, so the request arrives already saying where it is and what it’s about. The photo does the rest. “The thing next to the other thing on the second floor” is no longer a location anyone has to decode.
If one person reads every incoming request and decides who handles it, you have a bottleneck with a lunch break. Set up work order types and areas, then give each one an SLA. Use Gear AI automations to assign requests to the right team based on rules you define. An HVAC failure in the server room goes straight to the right technician on a tight SLA, and the squeaky door waits its turn.
On the mobile app, technicians open the work order with the photo, the asset’s past work orders and any attached documents. They can scan the asset’s tag on site, then log photos, materials and notes as they work. If the same chiller has had four work orders in two months, they know before they open the panel.
Silence is what creates duplicate requests. The Direct Page can show the open and ongoing work orders for an asset, so the next person who scans the code sees the problem has already been reported. That means fewer duplicate tickets and fewer “just checking in” calls to the front desk.
InterContinental Porto rolled out Infraspeak Direct across the hotel in four weeks. Housekeeping started reporting breakdowns directly, and maintenance calls dropped from more than 40 a day to about 10.
“The Housekeeping team quickly adapted to Infraspeak and they love it. They’re now reporting and fixing 70% of breakdowns using the Infraspeak Direct app.” — Filipe Soares, Engineer Lead, InterContinental Porto
Read the full InterContinental Porto story.
Digital requests leave a trail. Each one records a time, an asset, a location and a problem type. After a few months you can see which assets fail most, which sites report most and how long requests sit between being reported and being assigned.
That data tells you which repeat offenders to move into preventive plans. It tells you where a 5 whys analysis is worth the hour, and which maintenance KPIs to watch. Your reactive maintenance management starts deciding what becomes planned work, and that’s how you break the reactive loop.
Week 1 — count your channels. List every way requests reach your team today, from the phone line to the sticky note on the workshop door. Most teams find more than they expected.
Week 2 — tag the troublemakers. Put QR codes or NFC tags on your busiest assets and locations first. You don’t need to tag everything on day one.
Week 3 — set your rules. Define work order types, SLAs and assignment rules before go-live, so the first requests land in the right place.
Week 4 — open one front door. Tell people where to report problems and kindly redirect everything else there (yes, including the WhatsApp group).
Day 30 — look at the trail. Check how quickly requests get assigned and which assets keep coming back.
One day the east wing lift will make that noise again. This time, the guest who hears it scans the code by the door. Your technician gets the work order, the photo and the asset’s history before breakfast is over. With any luck, nobody gets stuck between floors this time.
See how the Infraspeak Direct Page turns a QR code into a work order →


)
)
)